How to diagnose Website performance?
Purpose:
- In a few circumstance, users (or website owner) found their website perform slow, and would like to identify which website component is performing slow
<script type="application/ld+json"> { "@context": "http://schema.org", "@type": "Article", "author": "George", "name": "How to diagnose WordPress Website performance?" } </script>
In this tutorial, we will demonstrate how to use Firefox developer console to show the website responsiveness.
Procedures:
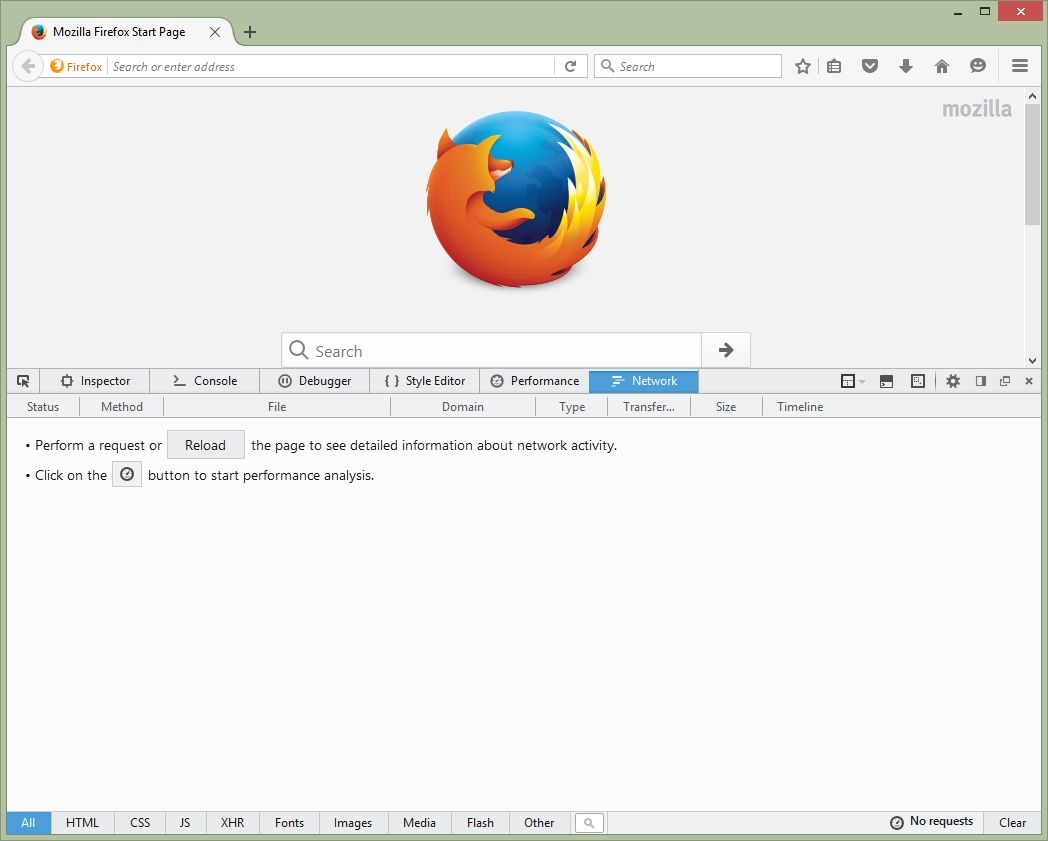
- Start a Mozilla Firefox (We prefer Firefox for simple user interface)
- Clear Browser cache
- Open Developer Console
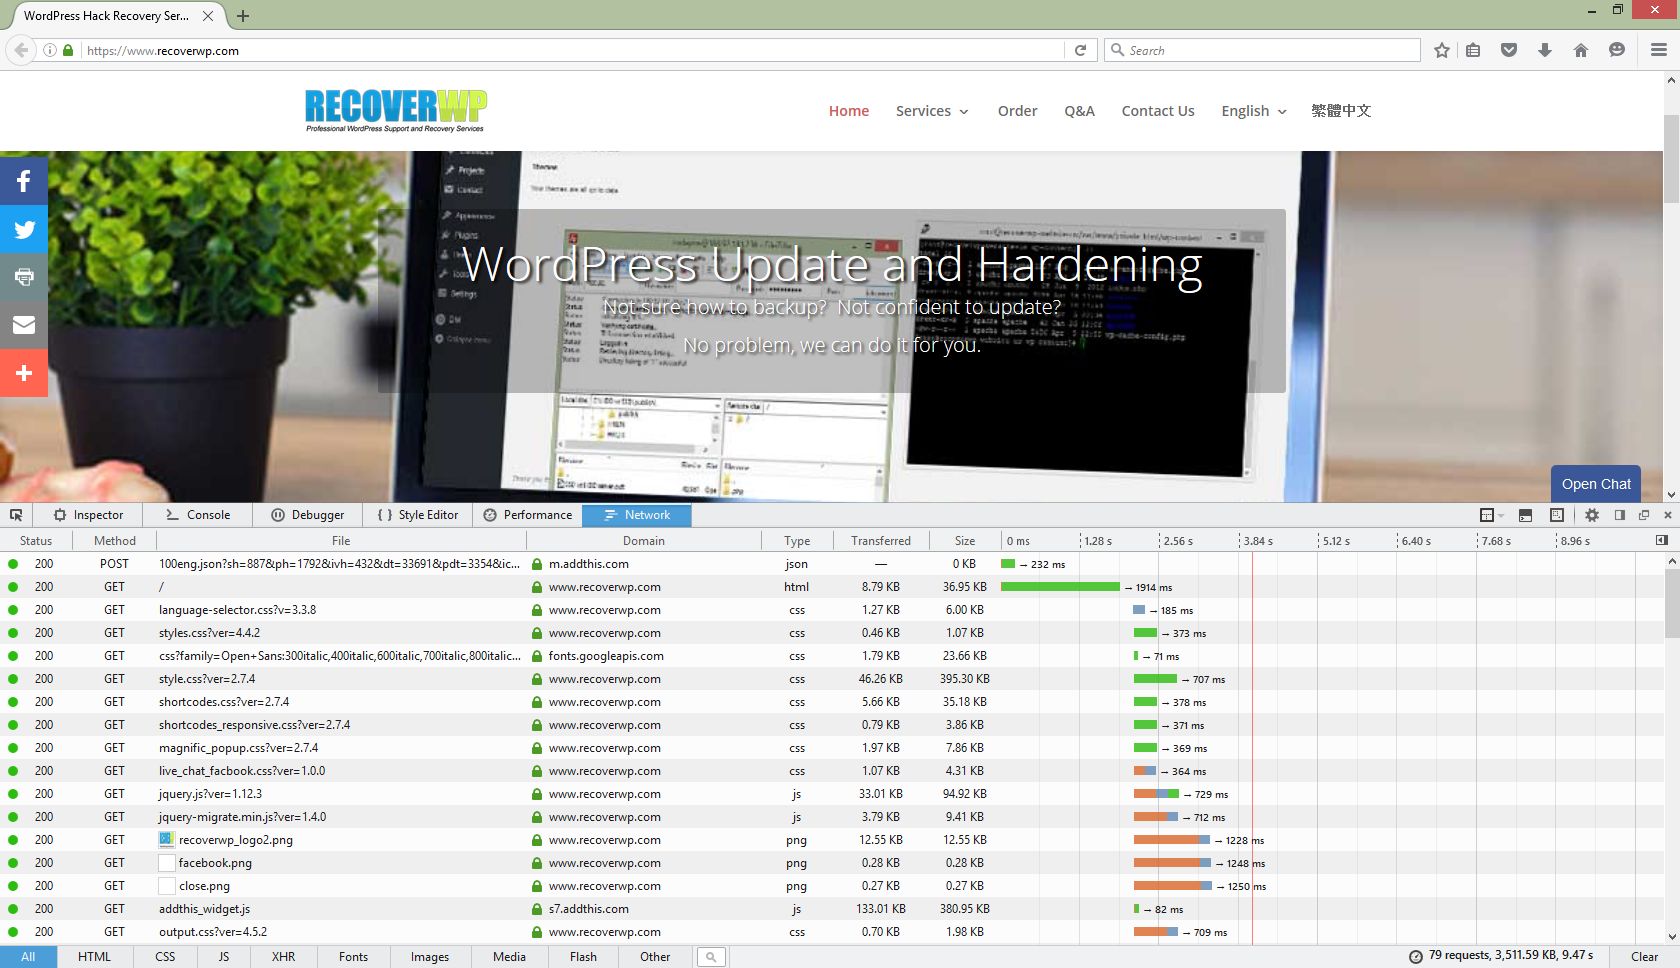
- Visit the website
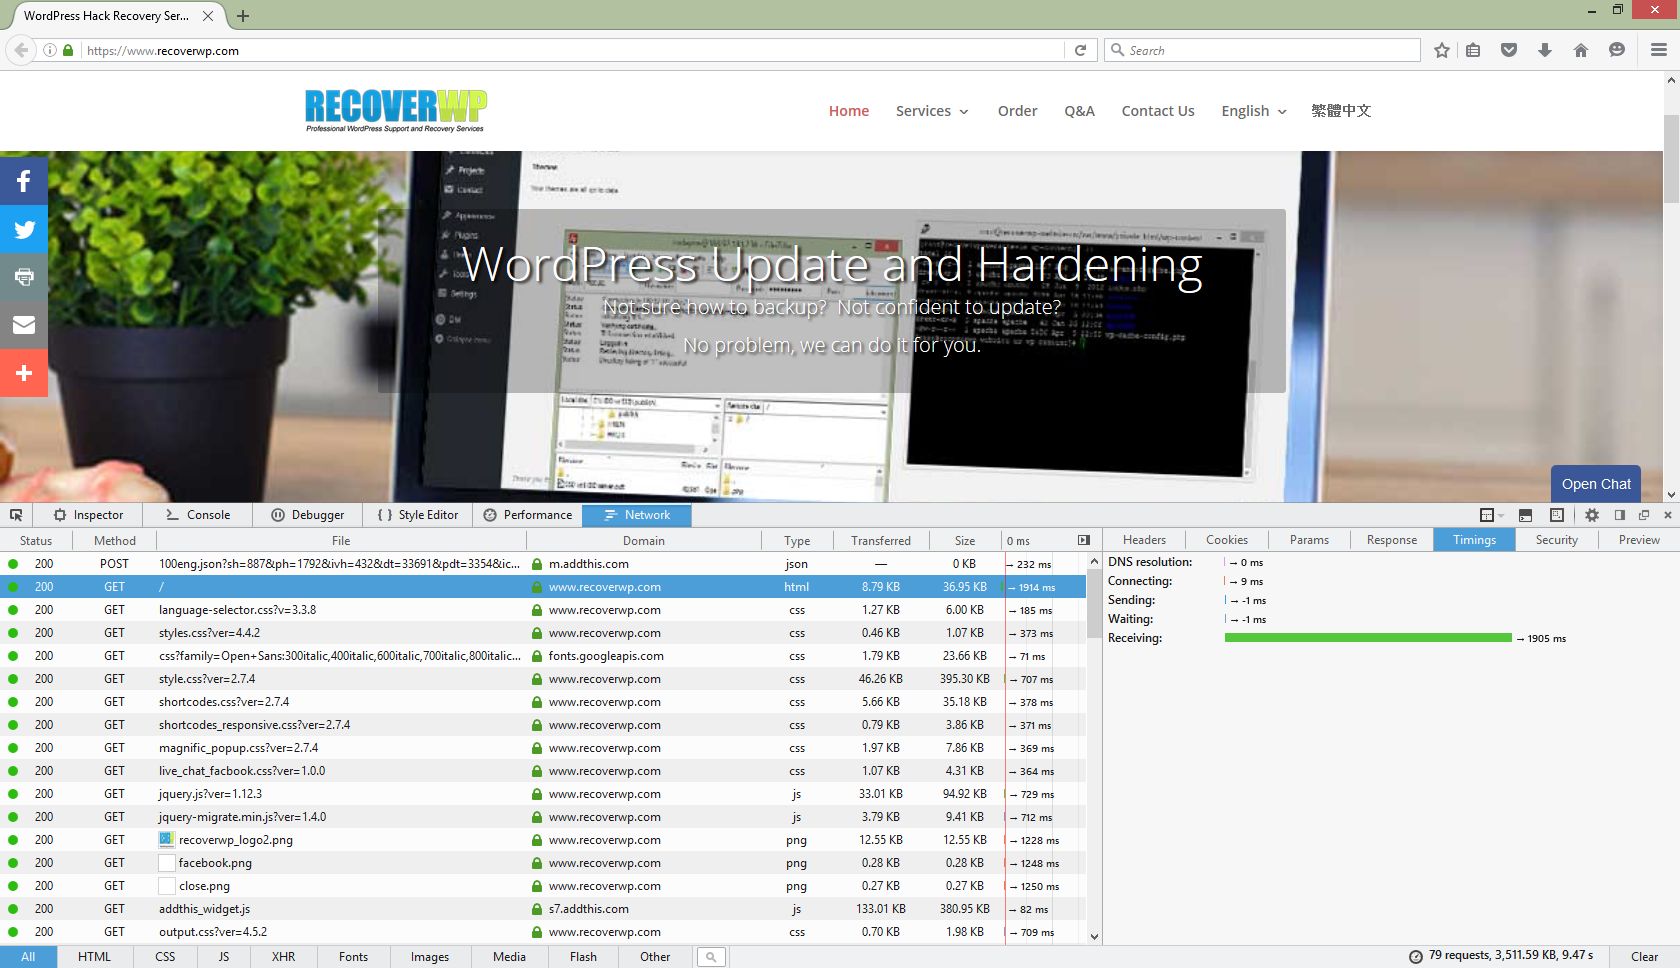
- Check the waterfall diagram, and identify which components used the most duration
Details:
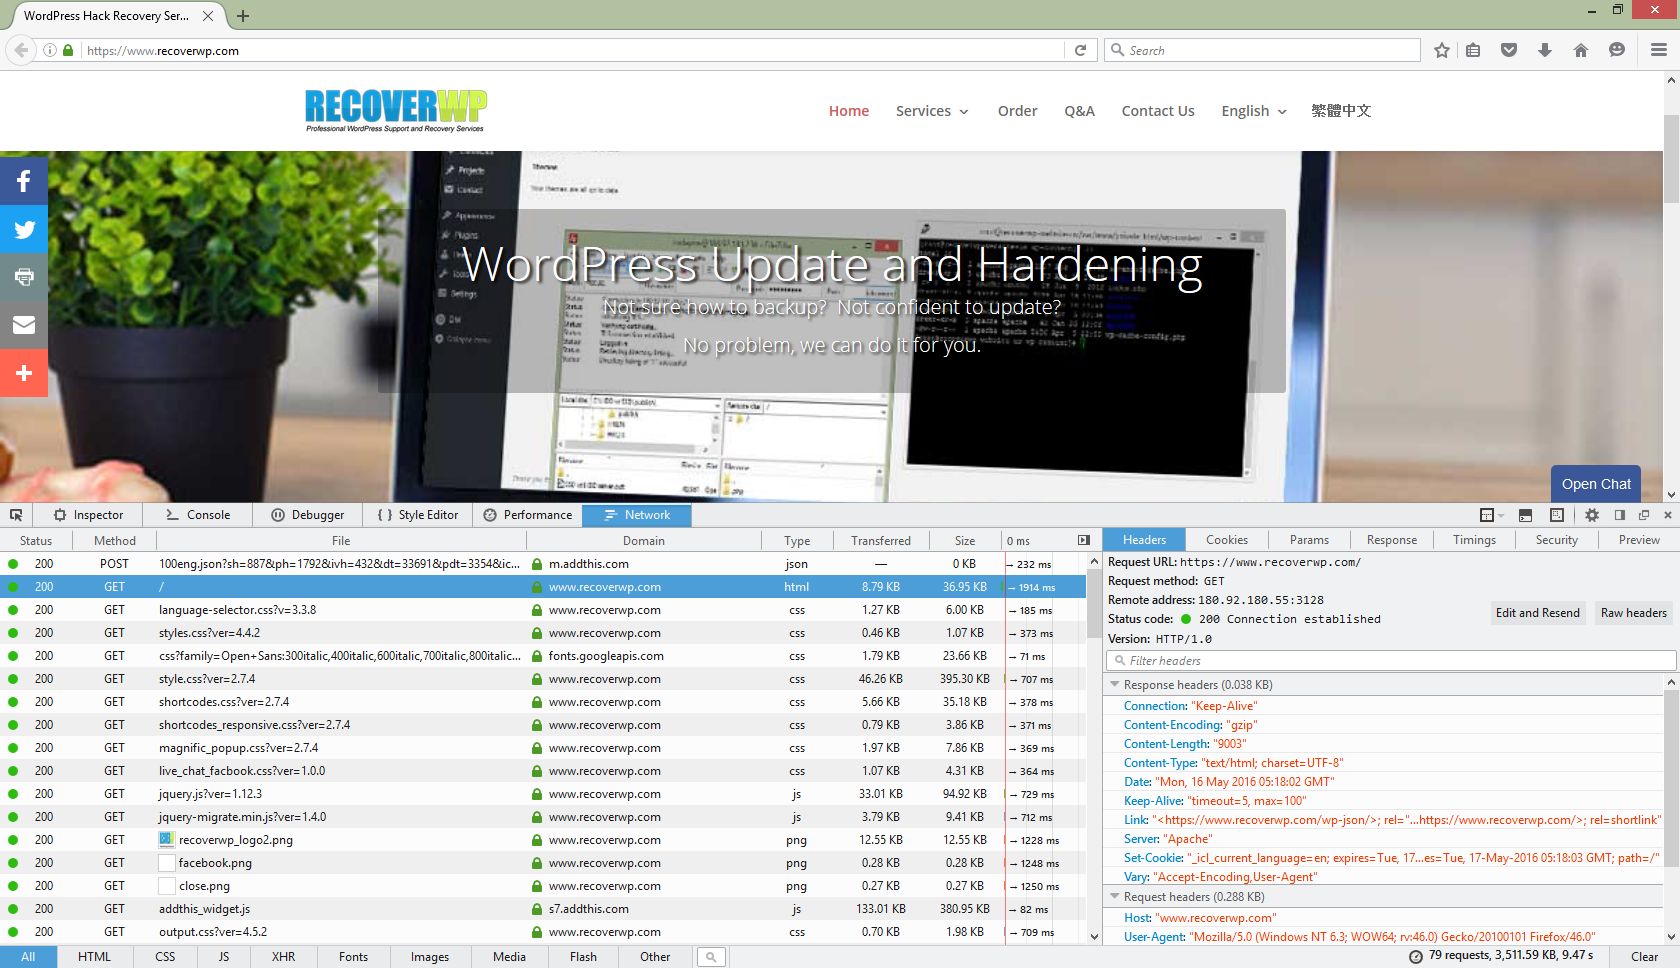
Also, you may check individual website item HTTP header information (e.g. Content-Encoding, Keep-Alive, Expires)
If you first page, e.g. index.php, performs slow, it shall to PHP or MySQL tuning.
About RecoverWP.com
RecoverWP.com is managed by web hosting professionals, who have been working on web hosting, WordPress website, security and vulnerabilities area since 2003.
Contact: (852) 3502-4863 | Email: support@recoverwp.com
Copyright 2015-2019 (c) Website Maintenance Service Limited


